In Part 1, we explained why passive acoustic monitoring is a strong addition to a practical MRV strategy. In this post, we share how we designed and executed our first acoustic pilot: what we planned before going to the field, how deployment worked in practice, how much audio we recorded, and what we learned from the first outputs.
Designing the pilot and organizing fieldwork
Selecting the right device
For this pilot, AudioMoth recorders were chosen. They are affordable and well suited for testing acoustic monitoring in real field conditions. They are not the highest-end recorders on the market, but they produce usable data and allow wider spatial coverage. That choice meant we could deploy at eight locations rather than only two or three with a more expensive setup.
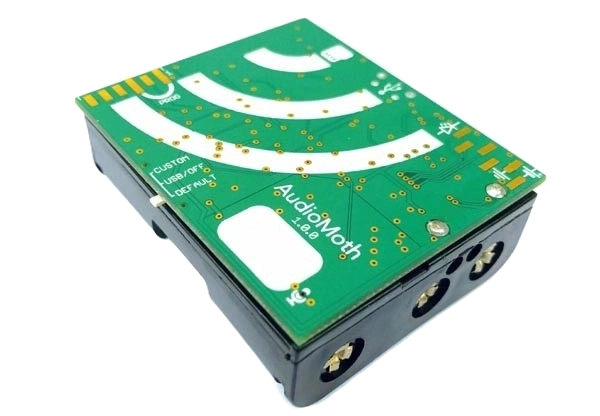
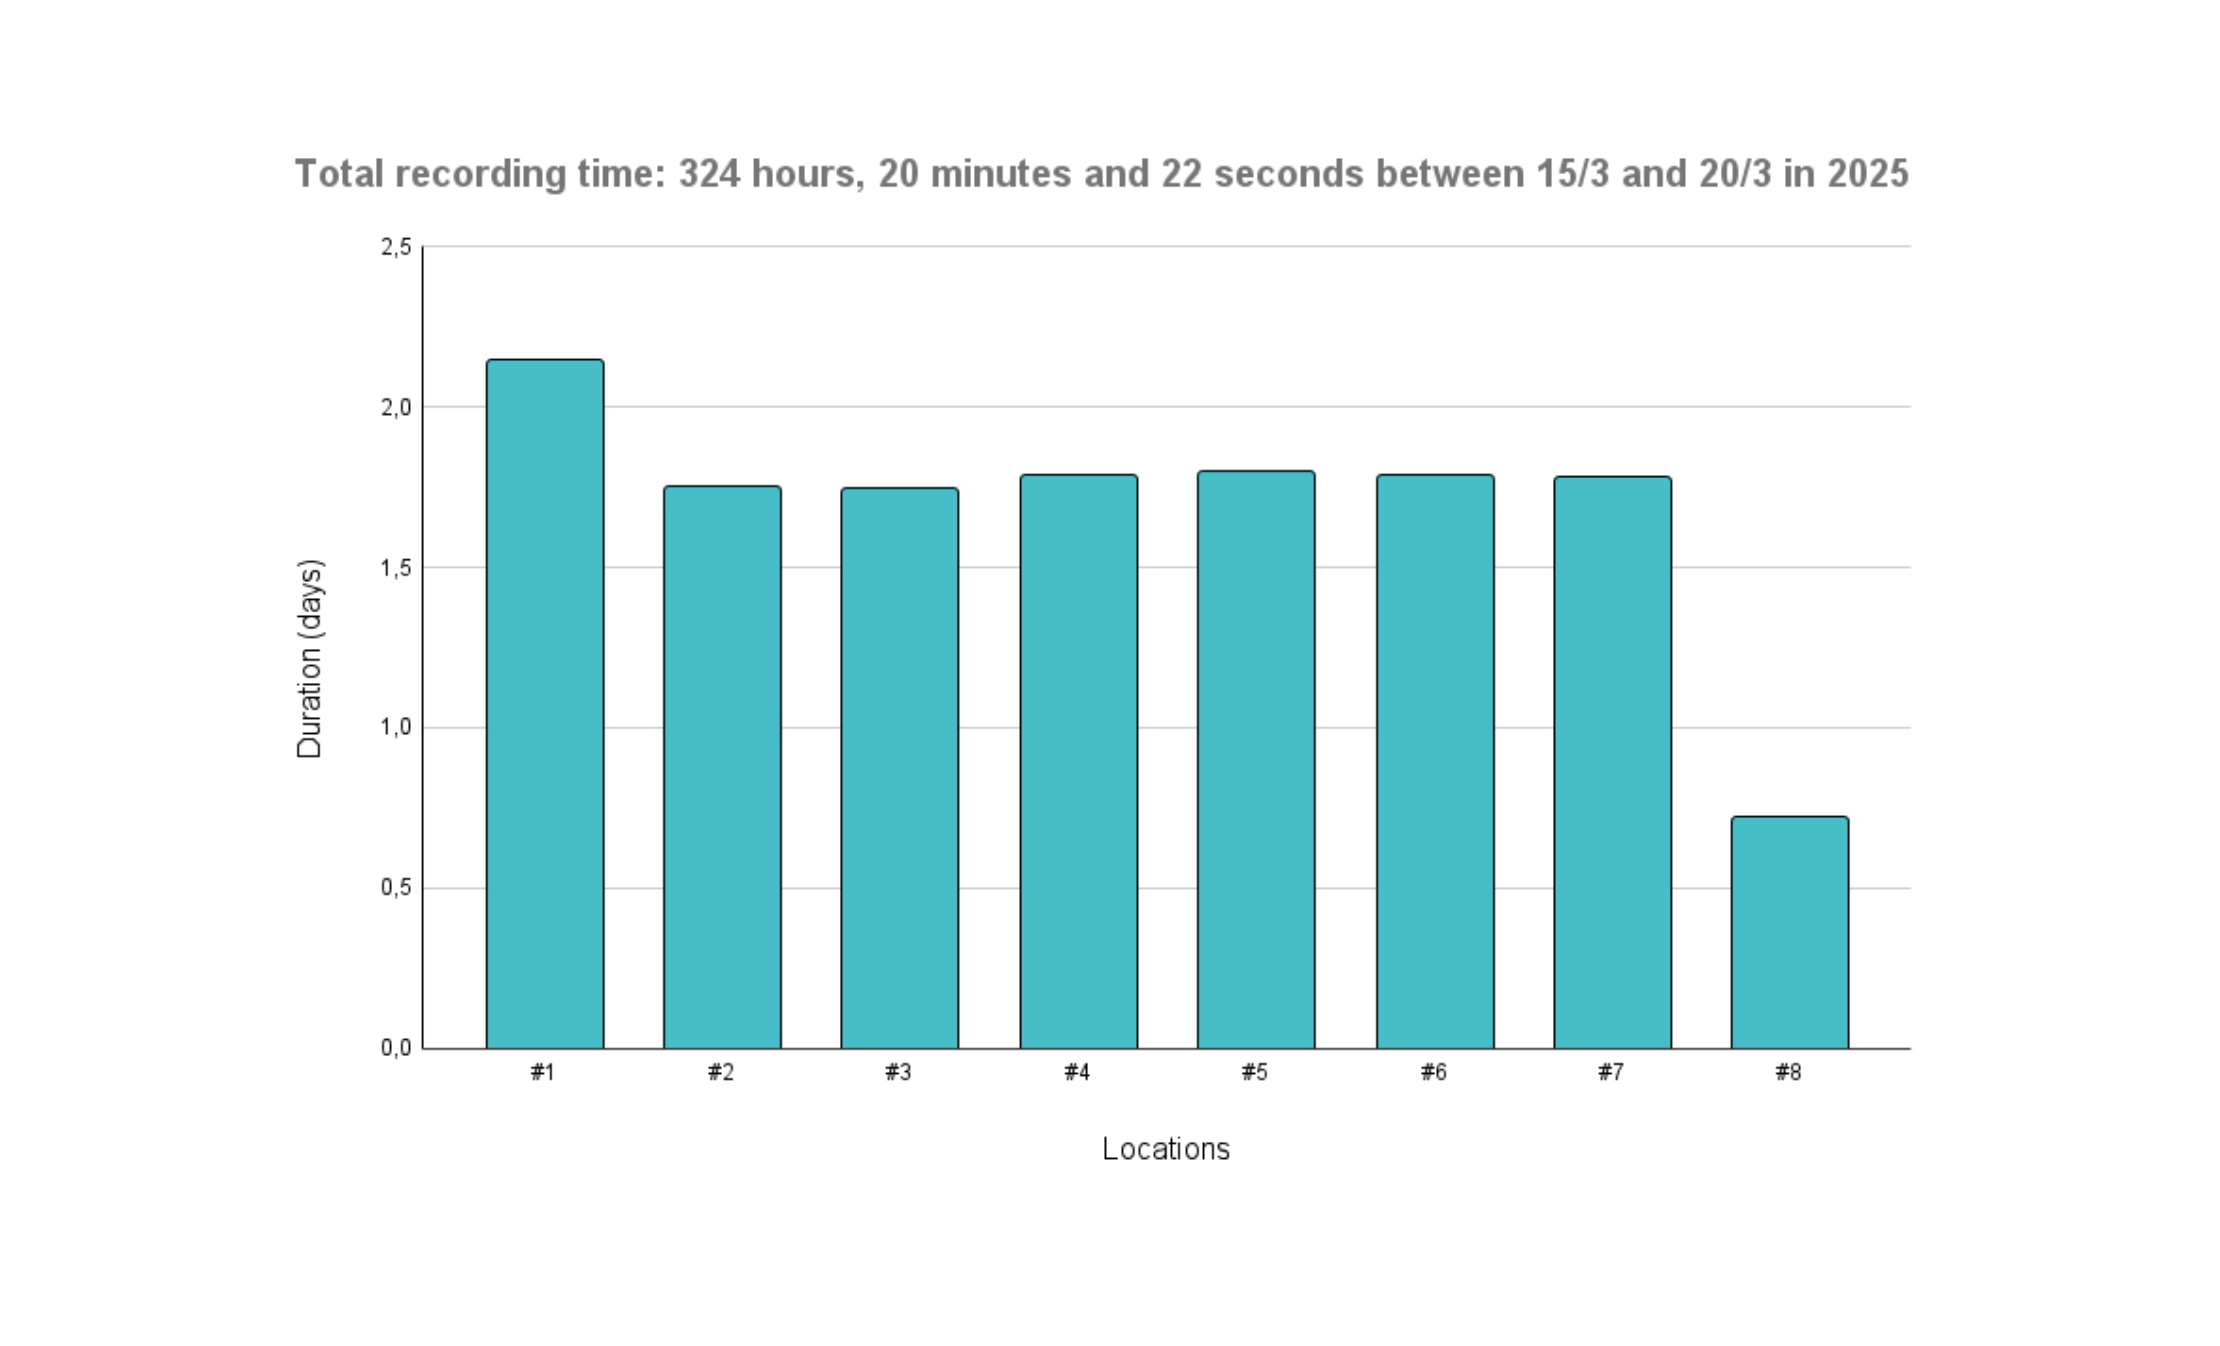
Before deployment, we prepared a short learning guide for the field team. AudioMoth has a manual, but our guide focused on how we wanted the sensors used in our project context. It covered deployment in the field, mounting height, placement considerations, and the exact programmed settings used in the pilot. Most sensors were programmed to record three hours around dusk and dawn. One sensor was programmed to record 24 hours per day. This one will help to refine the ideal recording schedule for future recording rounds.
In the field: deployment & recording effort
Our team trained local participants to support device setup in the field. Devices were installed across locations representing different habitats and land covers. Locations were chosen using random approach but logistically feasible.
The figure below summarises the total number of recording hours collected across all devices and locations.
Some early insights
During the pilot, we recorded 92 bird species across the deployment sites. Rainy showers were captured in several recordings, but bird activity remained detectable, and some species continued singing through the rain.
The early-morning and late-evening recording schedule worked well and produced clear periods of high activity. On the map below, we show species richness per location, which helps visualise how biodiversity signals vary across habitats and land covers.
Beyond birds, there are clear opportunities to improve how we detect and interpret insect communities. We will further investigate insect detection approaches, and we will also explore an additional option that can be very useful for ecological tracking: counting distinct call types and acoustic activity patterns, even when species-level identification is not possible.
Takeaway
This pilot showed that passive acoustic monitoring is a viable and scalable method to track ecological health across the project area. With relatively low cost sensors, we were able to collect hundreds of hours of usable biodiversity data across multiple habitats and detect clear differences in acoustic activity between locations.
The pilot also highlighted something important for the future: the strength of acoustics increases with scale and repetition. Expanding the number of recorders, repeating deployments over time, and combining acoustic data with other survey methods will allow us to build a more complete and repeatable biodiversity baseline for the project.